Eventure
A platform to add and promote your events
Project Overview
About the project
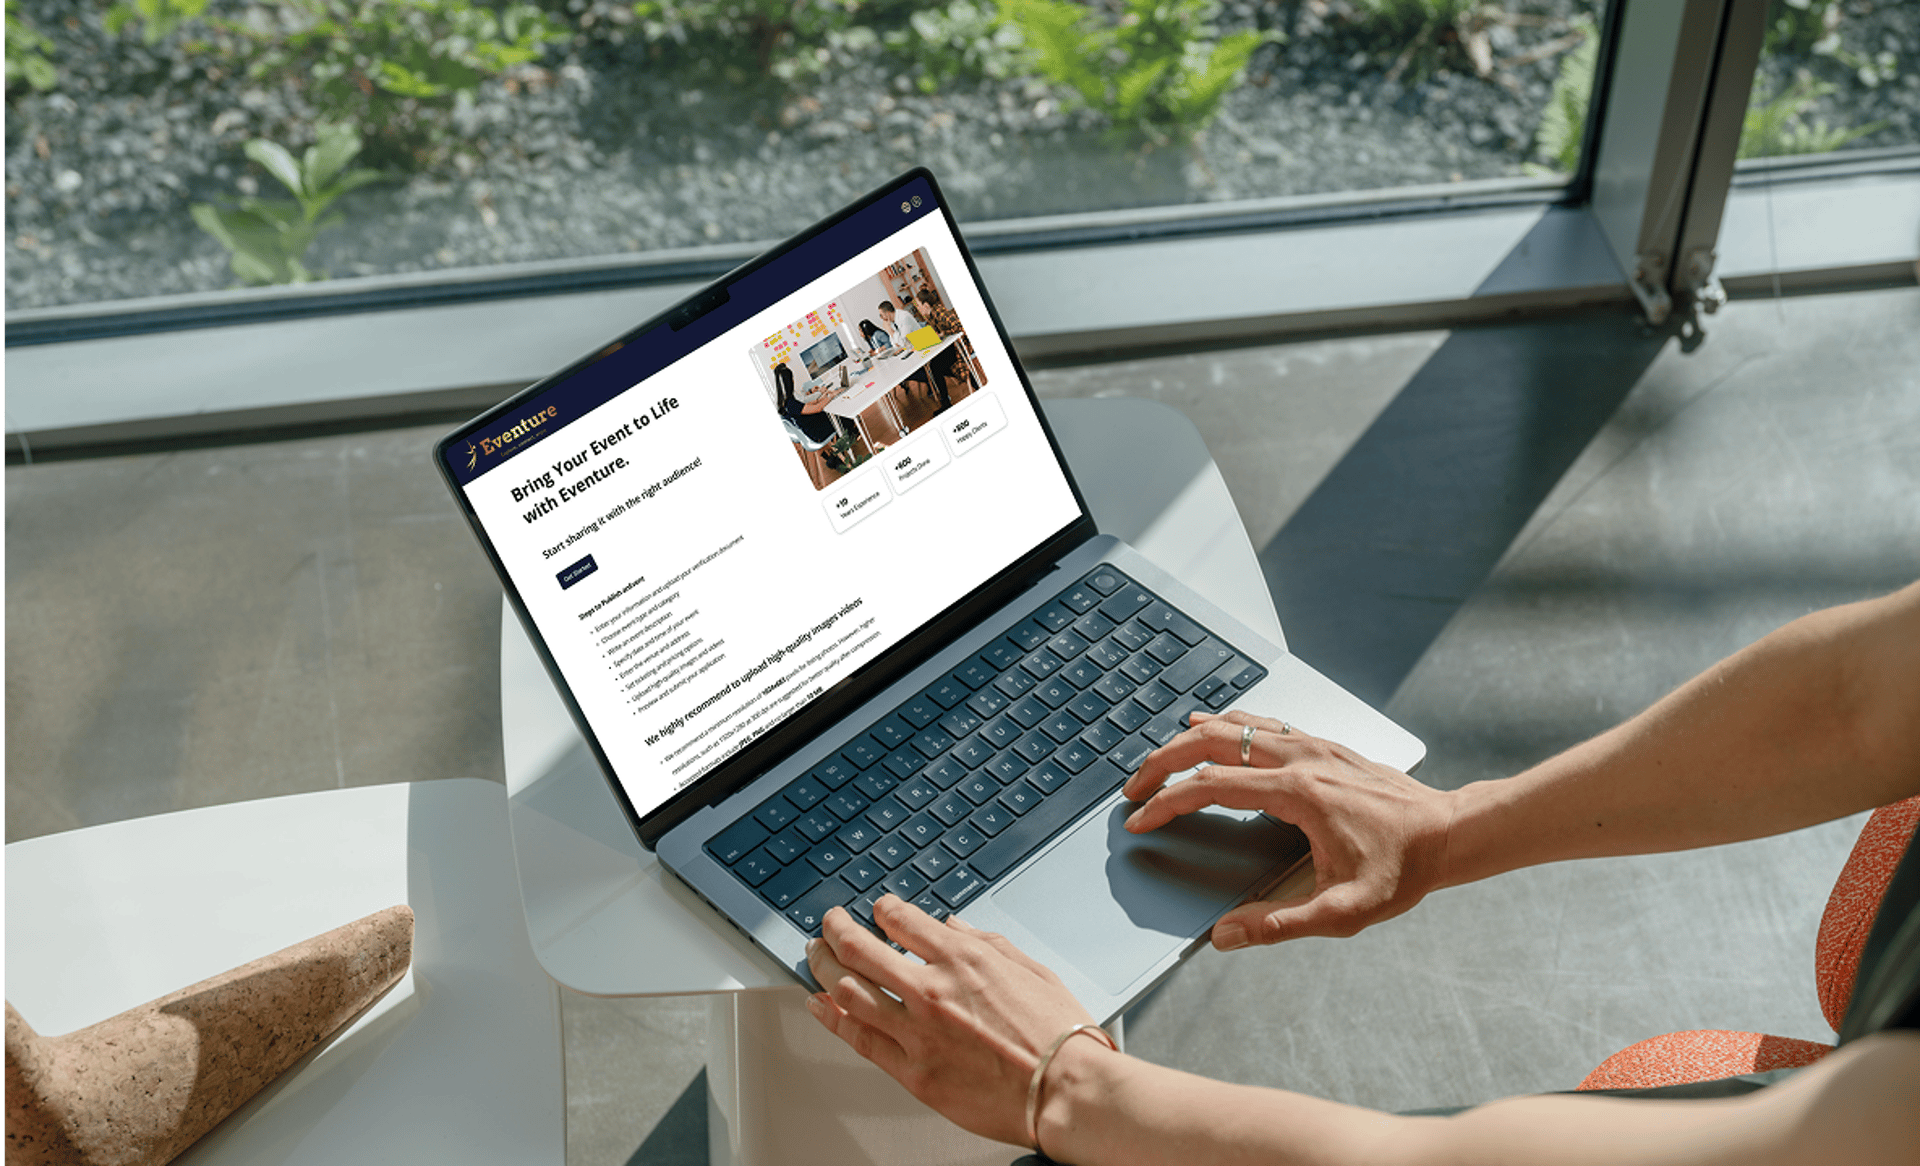
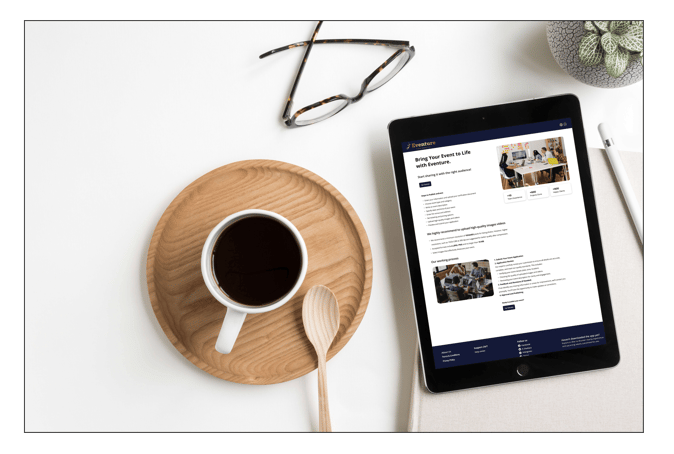
Eventure is a platform that empowers individuals and organizations to create, share, and discover local and large-scale events. In this phase of the project, we focused on simplifying and streamlining the process of adding a new event.
This case study covers the "Add Event" flow. To see how we designed the search, filter, and booking experience, please check out this case study.

Role
Tools
Team
Duration
UX/UI Designer
Figma, Miro
Maze, Zoom
Group of Two
Two weeks
Part time
Target Users

In this case study, our target users included individuals, companies, and organizers looking to publish and promote their events through Eventure.
Design Process
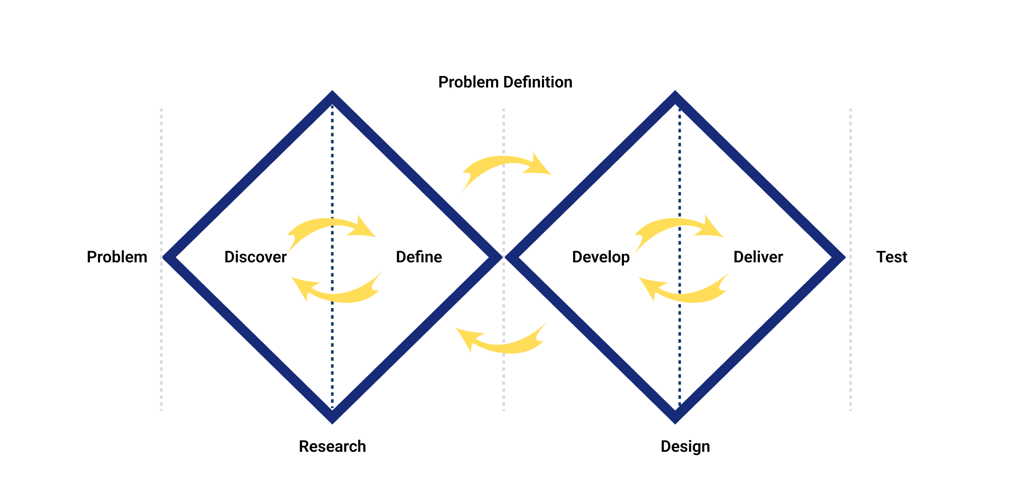
We used the Double Diamond framework to structure our design process—beginning with wide exploration to uncover user needs, then narrowing in to define the core problem, generate ideas, and translate them into design solutions. We finalized the process by refining and testing iteratively to deliver user-focused results.
Discover
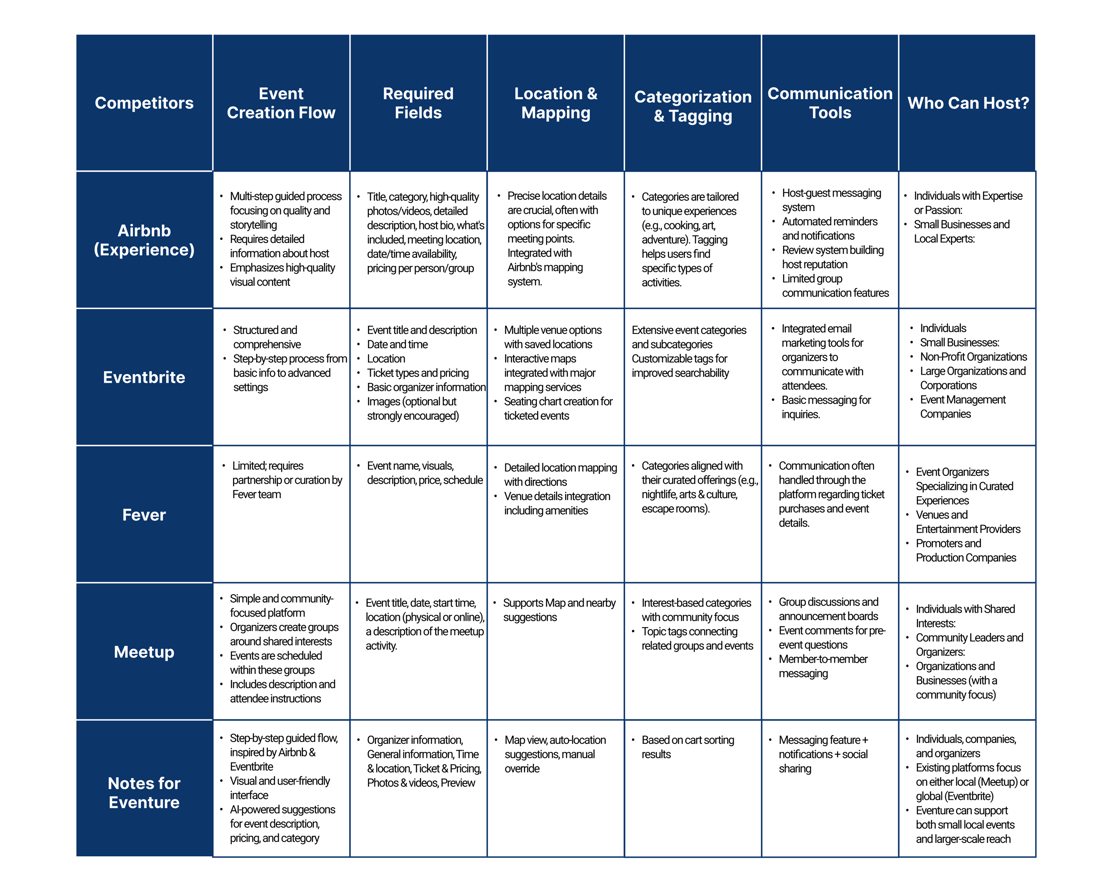
Competitive Analysis
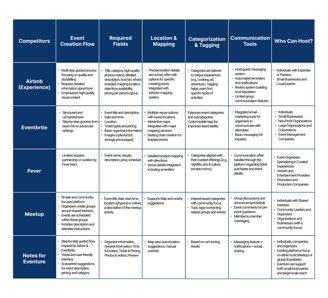
We conducted a competitive analysis to guide our research, thoroughly examining four platforms: Airbnb (Experiences), Eventbrite, Fever, and Meetup. Our evaluation focused on key factors such as the event creation flow, required input fields, how location is handled (including the use of maps), event categorization methods, available communication tools, and who is eligible to add events on each platform. The detailed findings of this analysis are presented in the table below.
Define
Persona
Story Board
User Flow
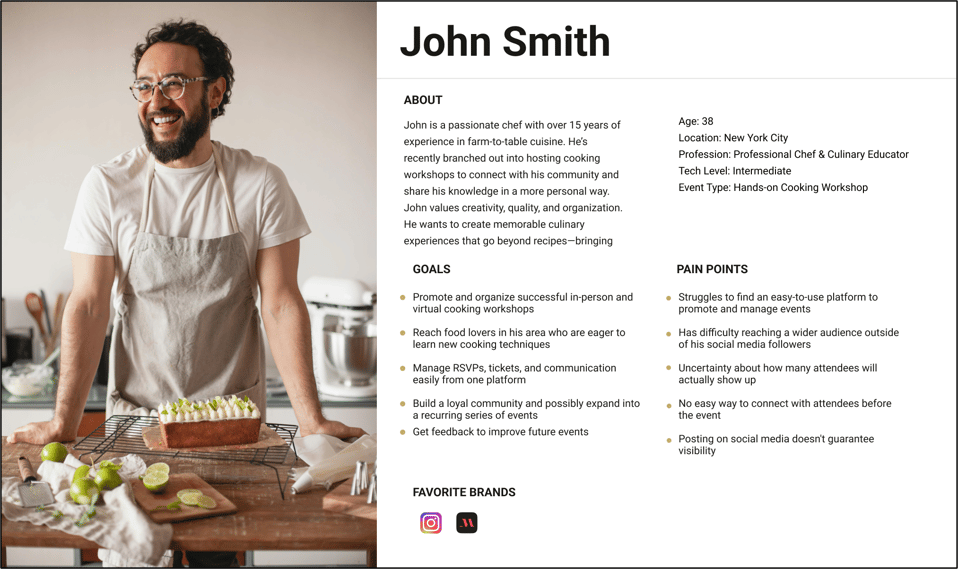
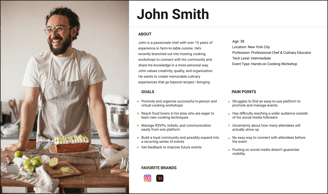
After conducting our research and competitive analysis, we created a user persona to capture the key characteristics, needs, and challenges of our target audience—guiding our design decisions with empathy and clarity.
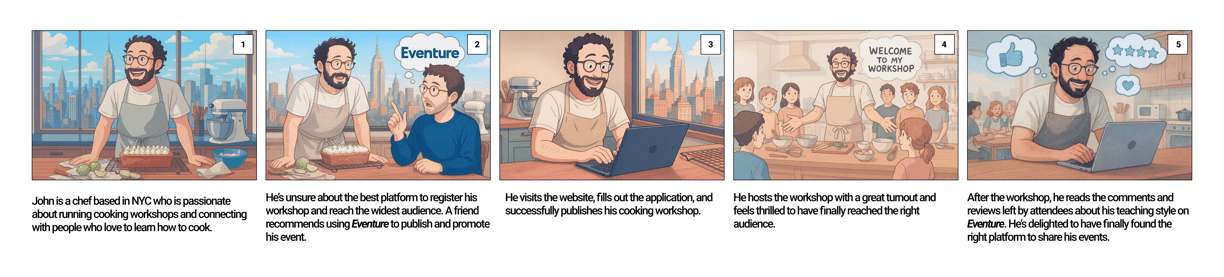
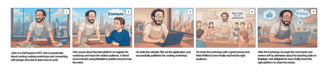
Based on our persona, we developed a realistic user scenario to illustrate how a typical user might interact with the platform—helping us identify opportunities to improve the overall user experience.
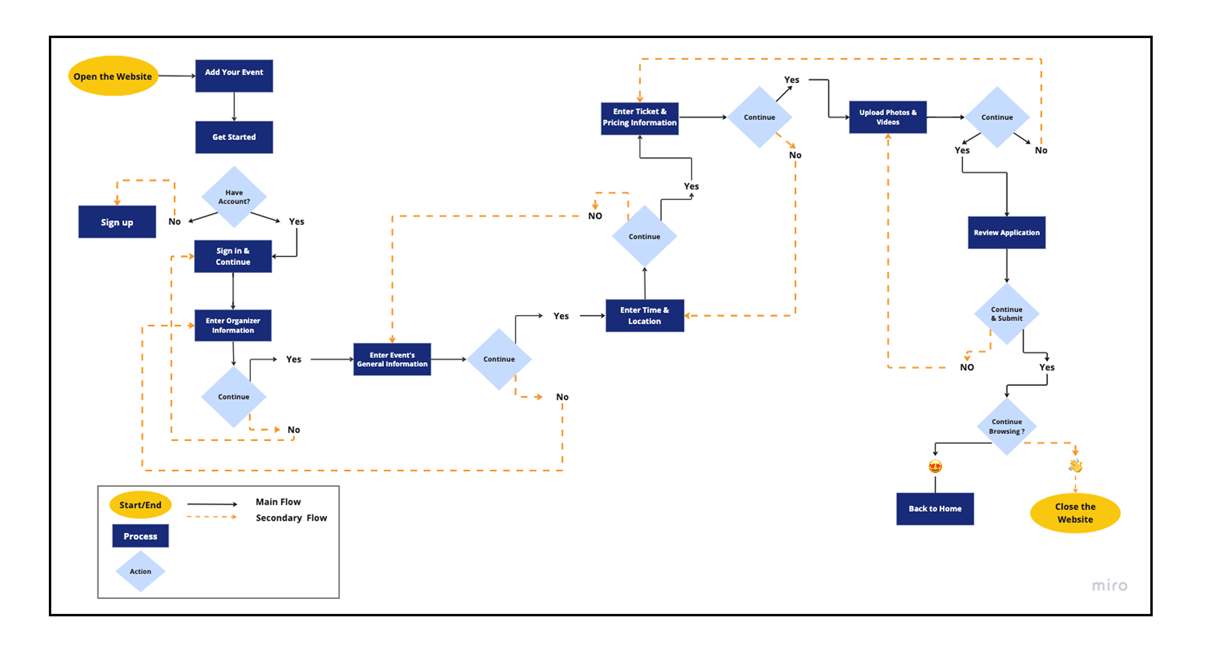
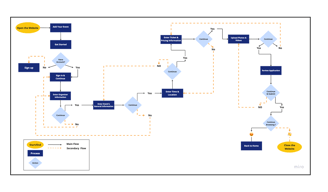
To visualize the user's journey through the platform, we created a user flow diagram that maps out each step of the event creation process. Each page includes a back button to enhance navigation, allowing users to return to the previous page—represented by a gold dashed line in the flow.
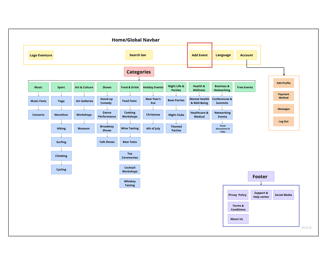
Site Map
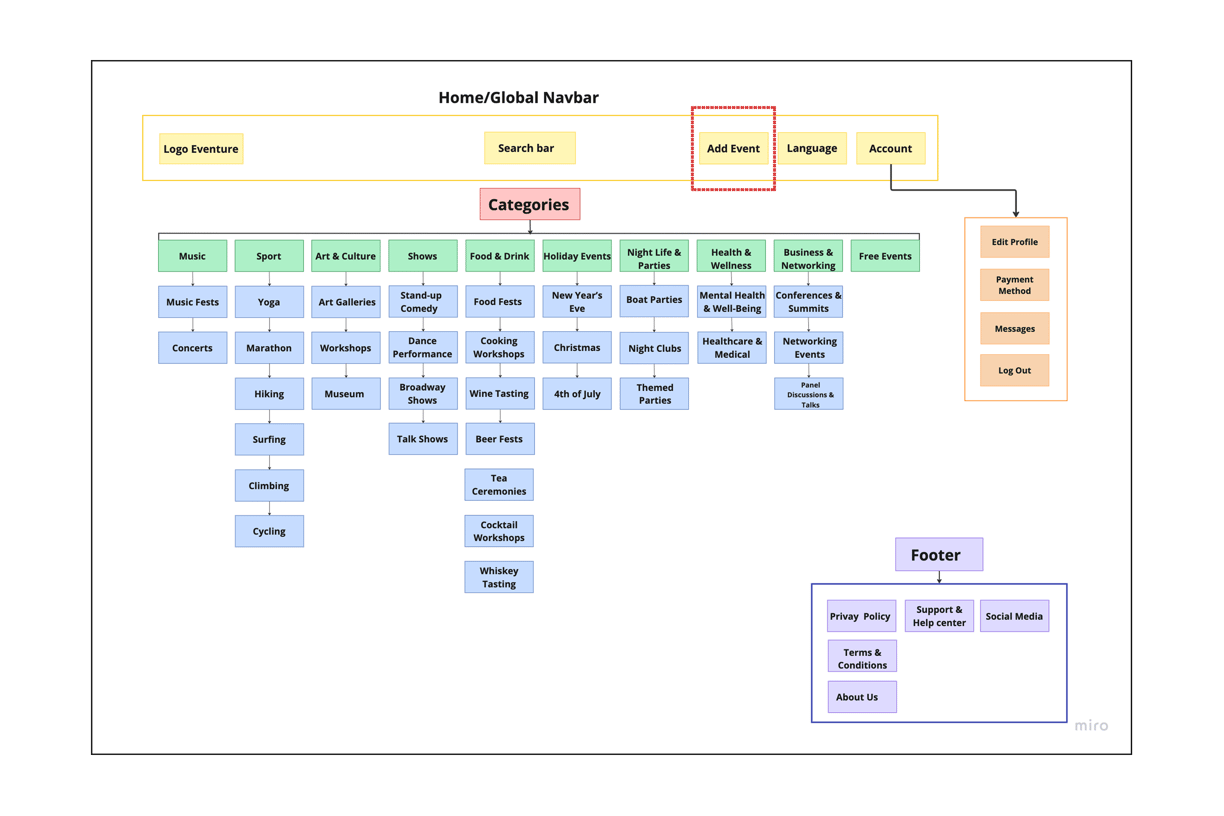
The site map shown here is the same structure we developed in our other case study, based on the results of a card sorting activity conducted in that task. For this task, we included the "Add Event" option directly in the main navigation bar to improve accessibility—shown with a red dashed box below.
Develop
Ideation & Wire-framing
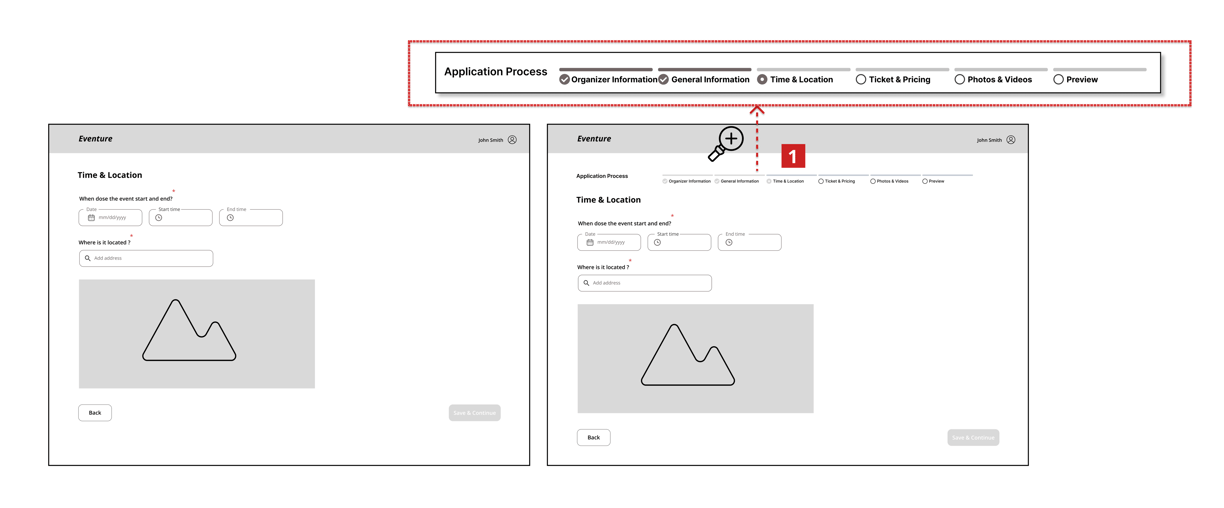
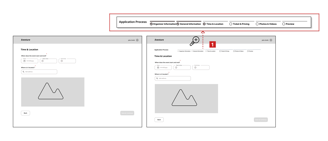
Following our research, we developed mid-fidelity wireframes in Figma to establish the overall layout and design direction. We then conducted usability testing to identify areas for improvement.Below are the wireframes shown before and after usability testing.
* Key changes are zoomed in to clearly illustrate the specific sections that were refined, making the design improvements more visible and easy to compare
1. In the initial version of our design, there was no stepper to indicate the user's progress through the application process. Based on feedback from usability testing, we introduced a stepper along with supporting UI elements to clearly show the current step and improve overall navigation.
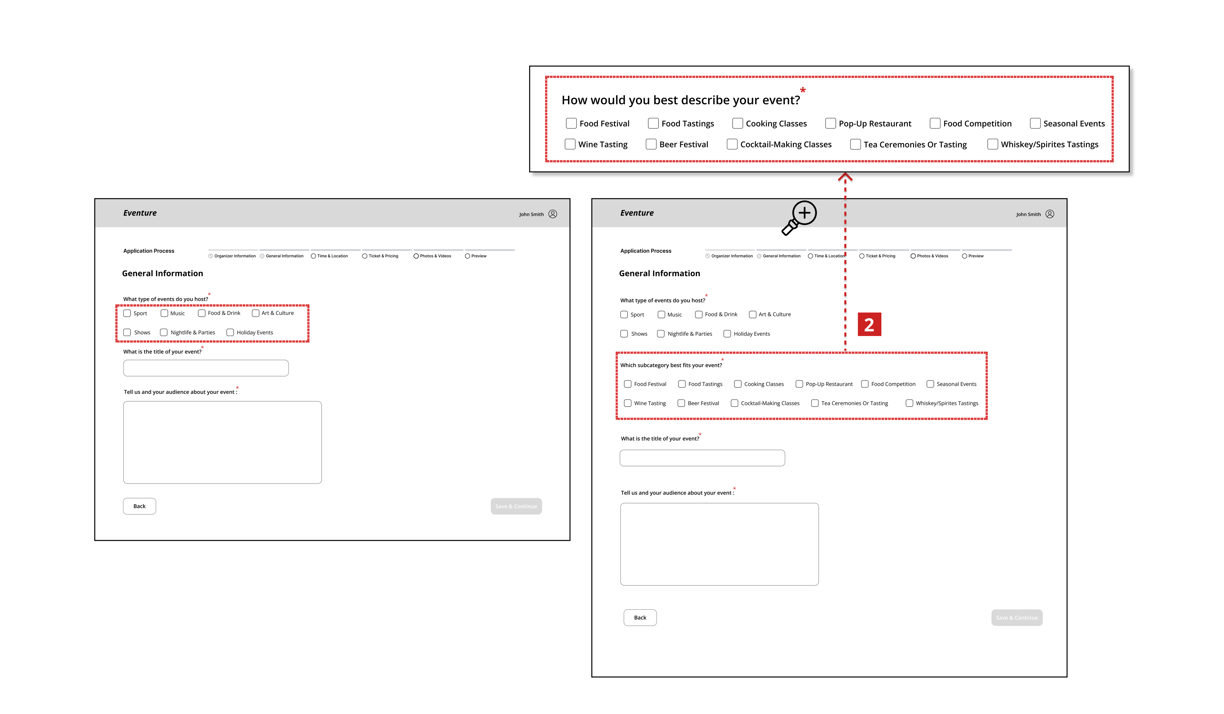
2. In the initial version, we only included the main event categories. Following usability testing, we added subcategories for each event type to provide greater clarity and help users more accurately define their events.
Before
After
Before
After
Deliver

UI Kit
Usability & Iteration (Phase 2)
Final Prototype
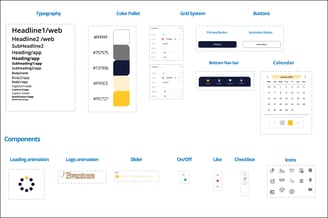
To begin developing high-fidelity interfaces, we built a cohesive design system that defined core visual elements such as colors, typography, and component dimensions—ensuring consistency throughout the product.
(This UI kit, shared with our other case study, provides a strong visual foundation that supports a seamless and engaging event discovery experience.)
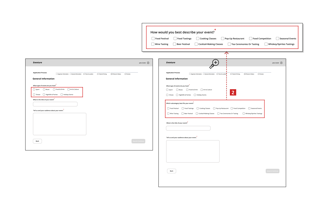
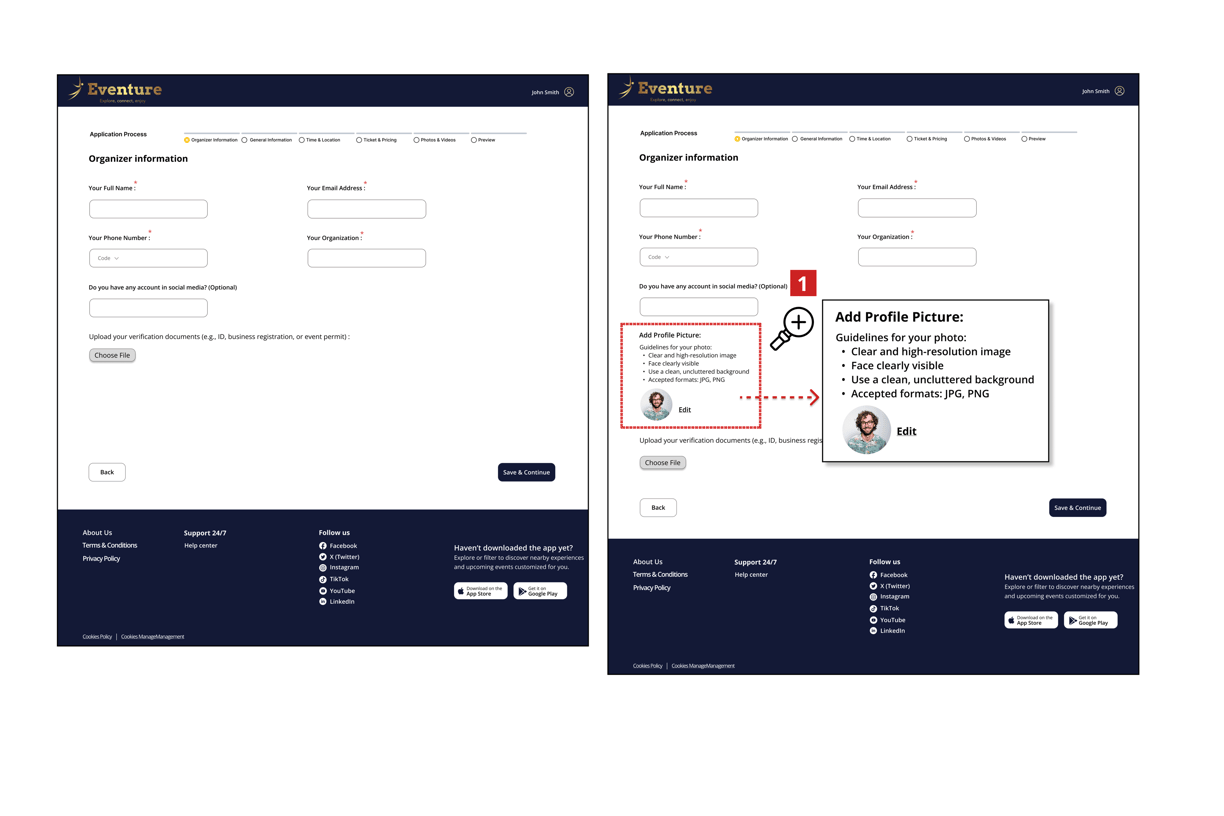
Once the high-fidelity wireframes were completed, we conducted a second round of usability testing to evaluate the design’s effectiveness. Based on the feedback, we made targeted refinements to enhance the user experience.
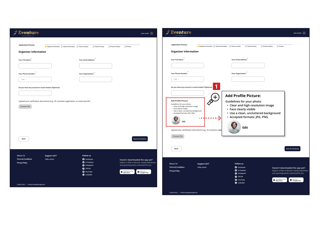
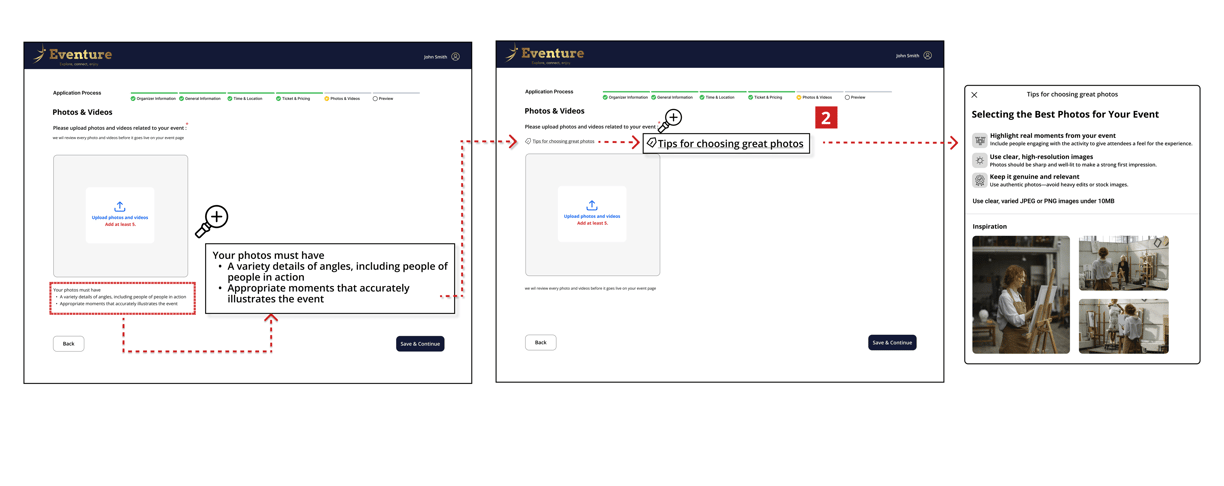
The before-and-after visuals below illustrate the key updates made to the final design.
1. Following the second phase of usability testing, we added a section to the Organizer Information page allowing organizers to upload a profile picture. This enhancement improves trust and personalization by helping attendees visually identify and connect with the event host.
2. In the initial version of our design, we included only brief bullet points outlining the criteria for photos and videos. However, usability testing revealed that these guidelines were too vague. In response, the final design includes more detailed descriptions and helpful tips to provide greater clarity and support for users during content upload.
Before
After
Before
After
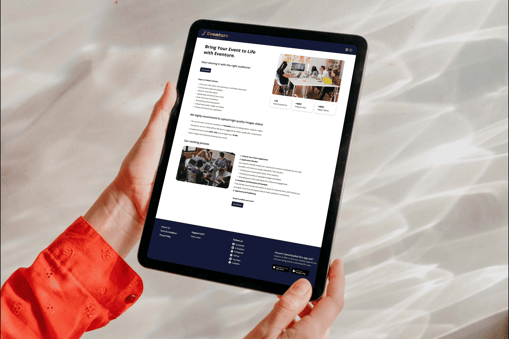
Explore the final interactive prototype here:
Takeaways:
One of the most valuable aspects of this project was designing for two distinct user groups: those searching for events and those publishing them. Working on tasks from both perspectives allowed me to better understand the goals, needs, and challenges of each side. This dual focus gave our team a more comprehensive view of the user journey and ensured that our design solutions considered and balanced the expectations of both audiences.